

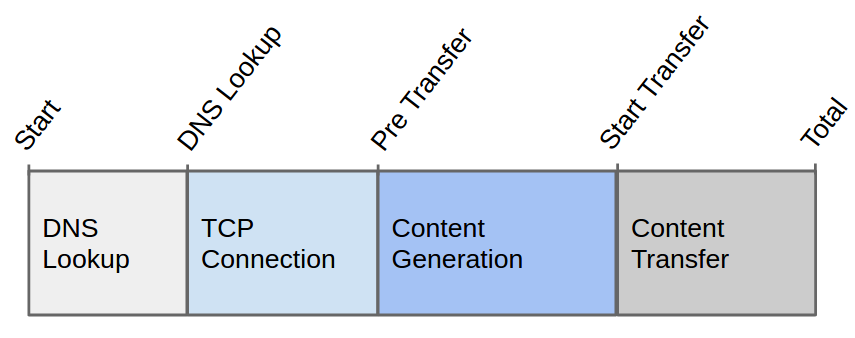
Basit bir istek 4 temel aşamadan oluşur,
Bazen sayfa yüklenme sürelerinin tespitini (daha doğrusu sayfanın indirilme )sürelerinin tespiti için curl mükemmel bir tercih olabilir.
Basit Kullanım:
|
1 2 |
curl -s -w "%{time_total}\n" -o /dev/null http://www.mynet.com/ 0.549 |
ZSH ile döngüye sokabiliriz:
|
1 2 3 4 |
for i in {1..3}; curl -s -w "%{time_total}\n" -o /dev/null http://www.mynet.com/ 0.735 0.832 0.604 |
BASH ile:
|
1 2 3 4 |
for i in {1..3};do curl -s -w "%{time_total}\n" -o /dev/null http://www.mynet.com/; done 1 ↵ 0.866 0.825 0.644 |
CURL komutu için varsayılan davranış GET’dir, ancak POST, DELETE PUT ve daha karmaşık istekleri yapabilirsiniz. Eğer cURL ‘e aşina değilseniz, başlamak için en iyi yer manpage ‘dir.
Bu şekilde HTTP zamanlama testi için bir “şablon” oluşturabilirsiniz :
|
1 2 3 4 5 6 7 8 9 10 |
\n time_namelookup: %{time_namelookup}\n time_connect: %{time_connect}\n time_appconnect: %{time_appconnect}\n time_pretransfer: %{time_pretransfer}\n time_redirect: %{time_redirect}\n time_starttransfer: %{time_starttransfer}\n ----------\n time_total: %{time_total}\n \n |
Şablon dosyası olarak yukarıdaki içerik ile “curl-format” adında dosya oluşturup bu dosya ile bir istek yapabiliriz. Aşağıdaki gibi dns araması,transter öncesi,yönlendirme,toplam süre gibi zamanlamaları ayrı ayrı görebiliriz.
|
1 2 3 4 5 6 7 8 9 |
curl -w "@curl-format" -o /dev/null -s http://mynet.com/ time_namelookup: 0.131 time_connect: 0.139 time_appconnect: 0.000 time_pretransfer: 0.140 time_redirect: 0.000 time_starttransfer: 0.149 ---------- time_total: 0.149 |
Options:
- -w “@curl-format”Biçim dosyası olarak curl-format’ın kullanma cURL söyler
- -o /dev/null isteğin output’unu /dev/null’ a yönlendirir.
- -s ilerleme çubuğu göstermemek için kullanılır.
- http://www.mynet.com/ istek yapılan URL..
Daha ayrıntılı bir sonuç arıyorsanız Apache Benchmark deneyebilirsiniz: Daha önceki paylaşımımda ab ile ilgili yazımı inceleyebilirsiniz.
|
1 2 3 4 5 6 7 8 9 10 11 12 13 14 15 16 17 18 19 20 21 22 23 24 25 26 27 28 29 30 31 32 33 34 35 36 37 38 39 40 41 42 43 |
ab -n 3 http://www.mynet.com/ This is ApacheBench, Version 2.3 <$Revision: 1706008 $> Copyright 1996 Adam Twiss, Zeus Technology Ltd, http://www.zeustech.net/ Licensed to The Apache Software Foundation, http://www.apache.org/ Benchmarking www.mynet.com (be patient).....done Server Software: Mynet Server Hostname: www.mynet.com Server Port: 80 Document Path: / Document Length: 482094 bytes Concurrency Level: 1 Time taken for tests: 0.679 seconds Complete requests: 3 Failed requests: 0 Total transferred: 1447746 bytes HTML transferred: 1446282 bytes Requests per second: 4.42 [#/sec] (mean) Time per request: 226.363 [ms] (mean) Time per request: 226.363 [ms] (mean, across all concurrent requests) Transfer rate: 2081.93 [Kbytes/sec] received Connection Times (ms) min mean[+/-sd] median max Connect: 8 9 1.9 10 12 Processing: 193 217 28.4 229 248 Waiting: 11 11 0.3 11 12 Total: 201 226 30.3 239 260 Percentage of the requests served within a certain time (ms) 50% 218 66% 218 75% 260 80% 260 90% 260 95% 260 98% 260 99% 260 100% 260 (longest request) |
So, what do you think ?